


 6 / 110

Annual Report
2016
Ni Hsin Resources Berhad
(653353-W)
5
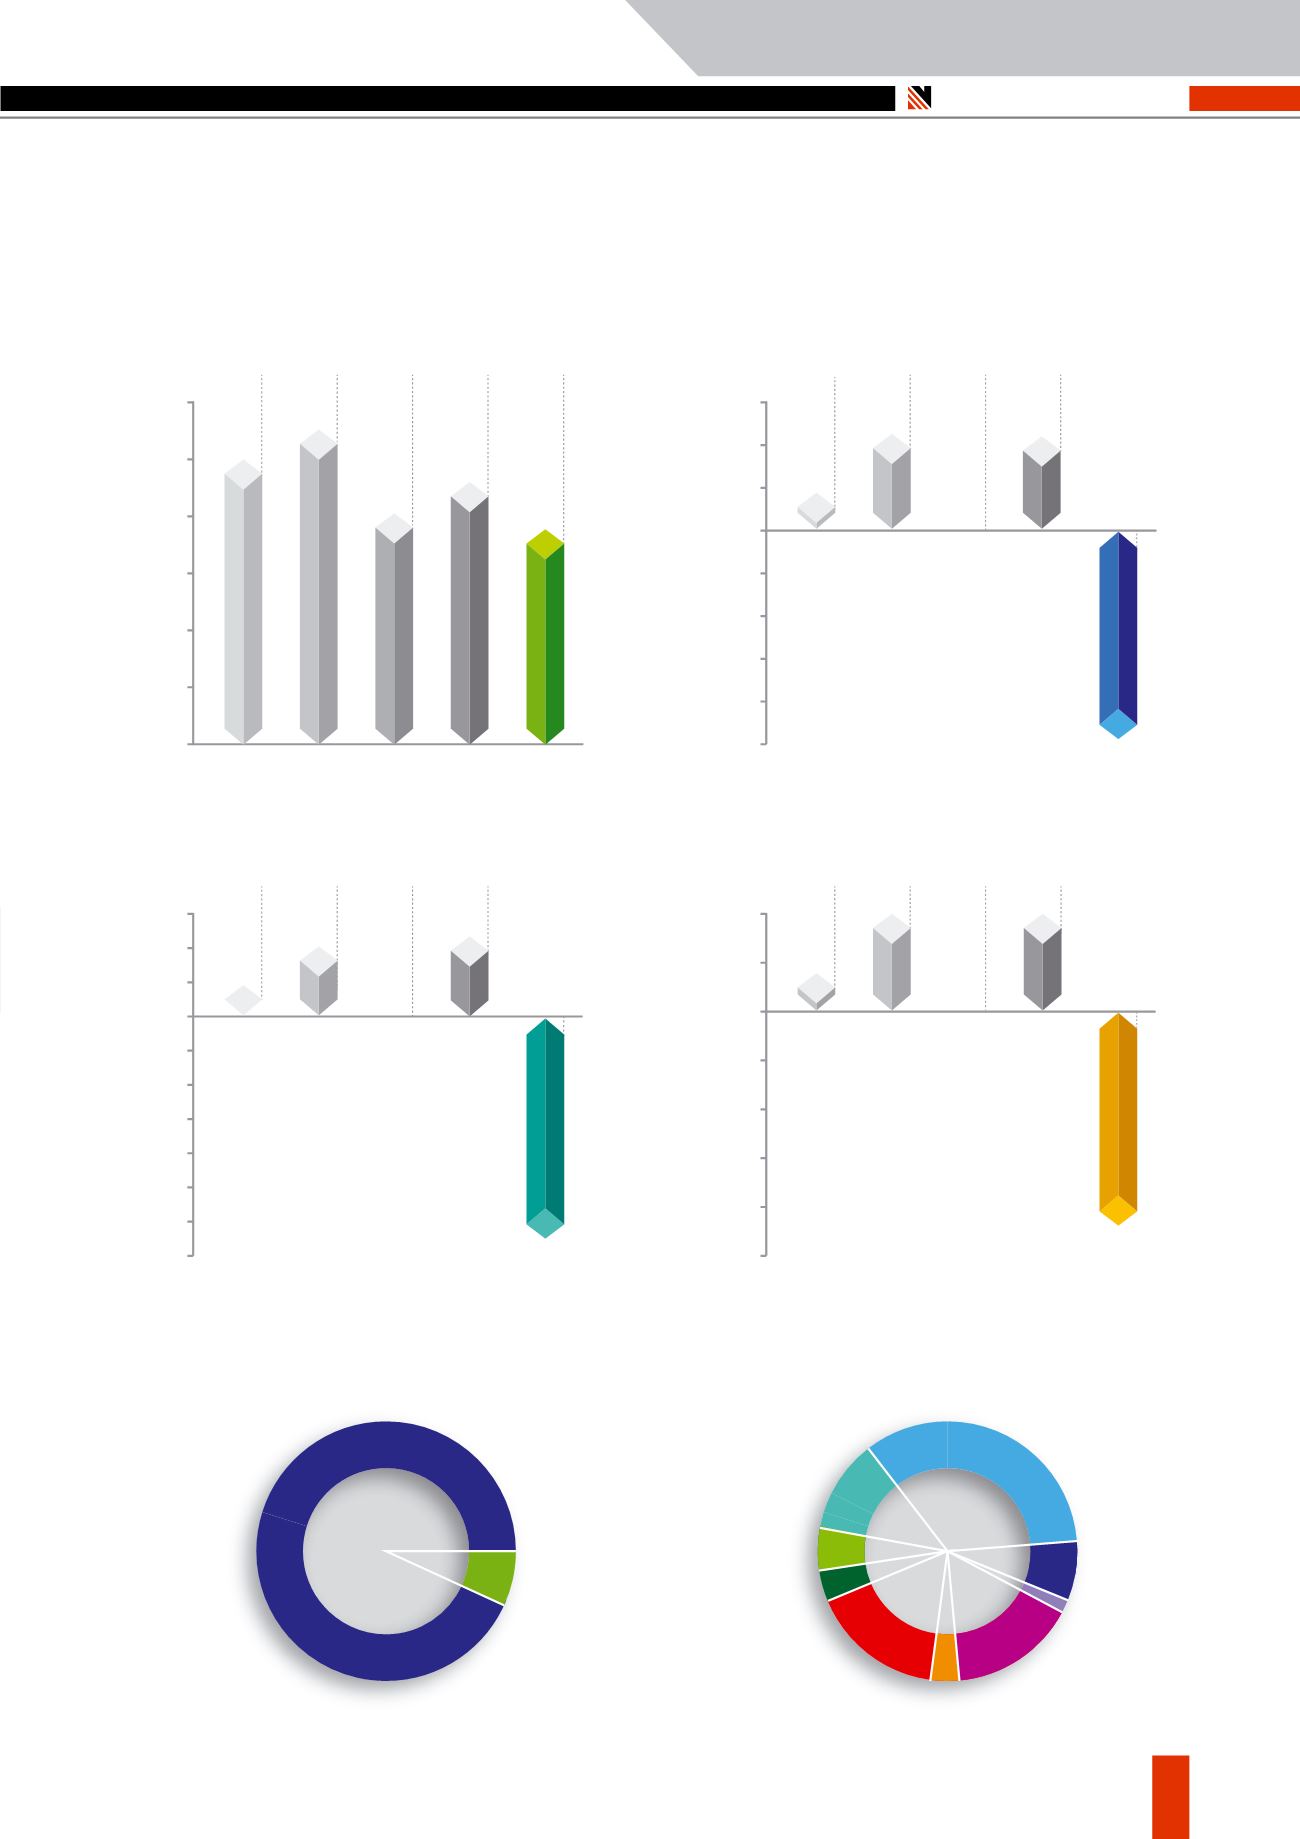
Five-Year Group Financial Highlights
(continued)
37,817
Revenue (RM’000)
40,000
50,000
60,000
30,000
20,000
10,000
0
‘12
‘13
‘14
‘15
‘16
49,935
55,150
40,727
45,936
Profit/(Loss) Attributable to
owners of the company (RM’000)
3,000
2,000
1,000
0
(5,000)
(4,000)
(3,000)
(2,000)
(1,000)
‘12
‘13
‘14
‘15
‘16
905
2,279
57
2,216
Profit/(Loss) Attributable to
owners of the company
After Tax Margin (%)
Local vs Export Sales 2016
Group Revenue by Country 2016
4.0
6.0
2.0
0
(2.0)
(4.0)
(6.0)
(8.0)
(10.0)
(12.0)
(14.0)
‘12
‘13
‘14
‘15
‘16
1.8
4.1
0.1
4.8
Net Earnings/(Loss) Per Share (Sen)
1.0
0.5
0.5
0
1.5
1.0
2.5
2.0
‘12
‘13
‘14
‘15
‘16
0.4
1.0
0.02
1.0
Export
89%
Local
11%
Japan
37%
Korea
8%
Others
7%
Local
11%
China &
Hong Kong
2%
Taiwan
12%
Singapore
3%
Europe
14%
USA &
Canada
6%
(2.2)
(4,914)
(13.0)